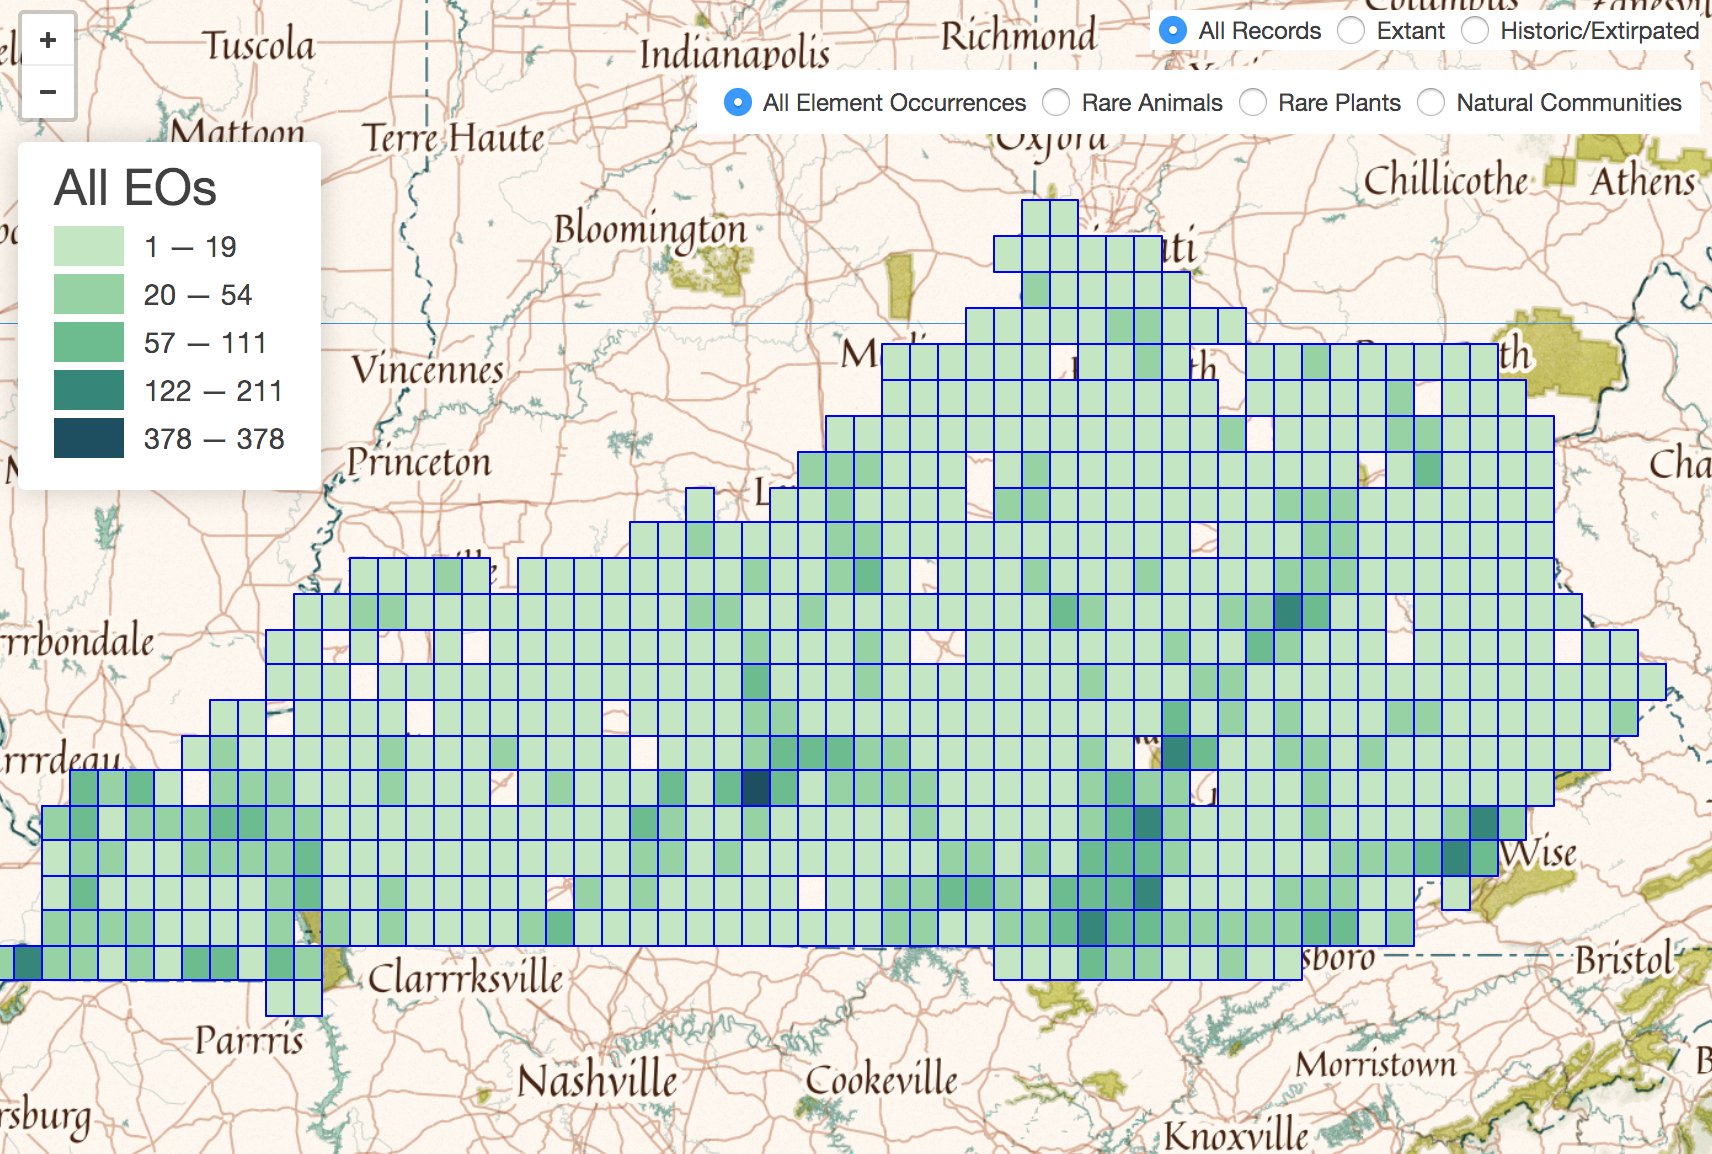
Kentucky Biodiversity Project
Groundbreaking Quad Heat Map to kick the start of the Kentucky Biodiversity Project.
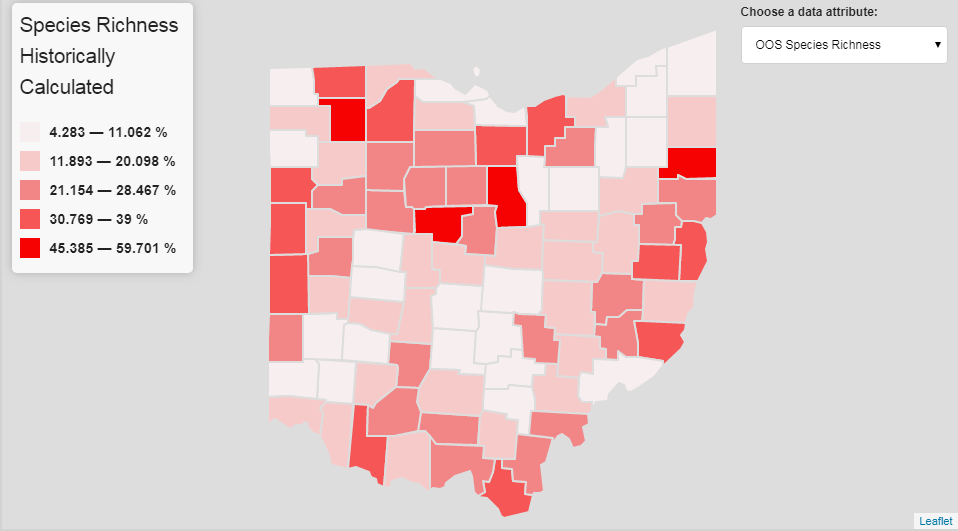
Ohio Odonate Species Richness
The Ohio Odonata Society is collaborating with the Ohio Division of Wildlife to update the original 1991-2001 odonate survey.
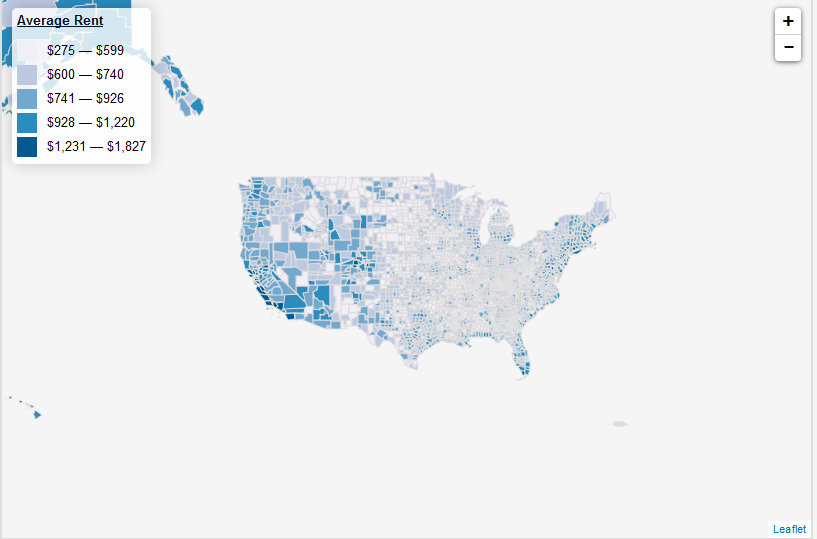
Project Two
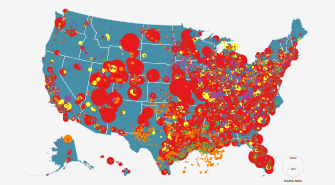
Here's a map of the US median us rent displayed in an interactive chlorpleth map demonstrates the ability to create 'ckmean' breaks. In addition this is my first map using jQuery.
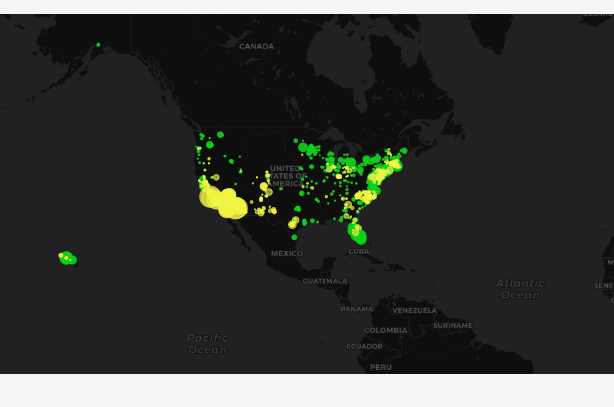
Project Three
Here's another #ThrowBackTuesday map where we mapped the distribution of energy sources of the greener variety. It's has some neat mouse-over and popup stuff going on.
Project Four
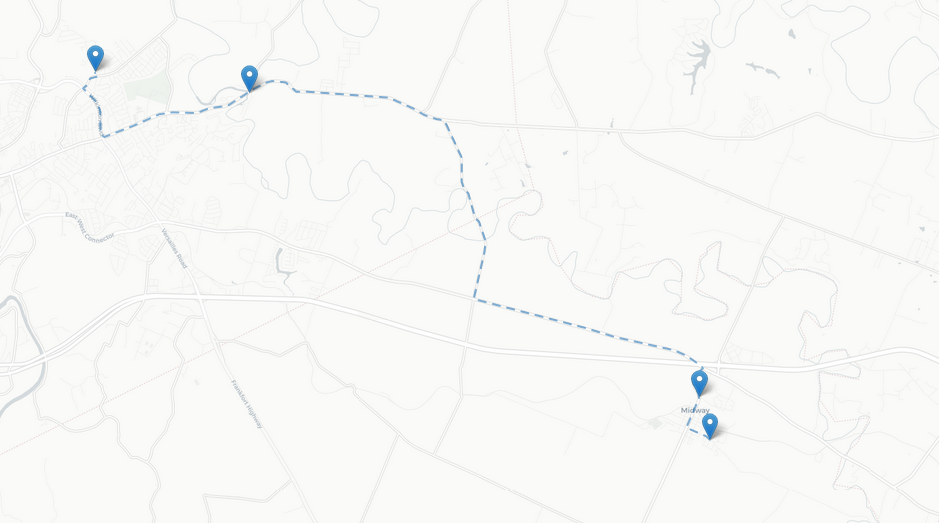
From GPX to GeoJSON. If memory serves me well, we used an interactive tool online to edit a file and create this GeoJSON that is used to drive this map of how I used to drive to work.
About me

Hi, I'm Ian. By title I'm a geoprocessing specialist 3 (geo3), which means I'm just a little better then a geo2 and a whole lot better than a geo1. As a geoprocessor, my strong suite is not cartography, web maps, web design, and certainly not web application programming. I am, however, really good at - as my boss puts it - making plans and doing stuff.
When I'm not yelling profanities at the computer monitor, I'm stacking benjamins . . . well, not really. I'm either taking kids to doctor's appointments or operating my taxi service Perros y Pizza!
Skillz
- GIS
- ArcMAP, QGIS, and GDAL for data analysis, manipulation, and format conversion
- DBeaver and SQL Developer for data querying
- Web Mapping
- ArcGIS online with Collector for ArcGIS
- JSON query for layers on ArcGIS Rest Services
- Coding
- Learning JavaScript, Java, (has been) SAS